Geogebra
GeoGebra can be used to study and deepen your understanding of derivatives.
Specifically, it will be useful for:
- Interactively visualizing graphs of functions and their derivatives.
- Dynamically exploring how functions change and their characteristics, such as maxima and minima.
- Manipulating and making conjectures that help develop your mathematical skills.
In this lesson, you'll find some examples of how to experiment with GeoGebra.
1. Plotting the Graph of a Function and Its Derivative
In GeoGebra you can plot the graph of a function and its first derivative, easily visualizing the function’s behavior in relation to its slope.
For example, for the function  :
:
Command in GeoGebra:
- Enter to plot the graph of the function.
- Enter
 to calculate and plot the first derivative of
  .
.
What you will get:
GeoGebra will display the graph of and its derivative  , allowing you to observe how the function’s slope changes.

2. Derivative of a Function at a Given Point
GeoGebra allows you to easily calculate the value of a derivative at a specific point, which is useful for understanding the slope of the function at that point.
Command in GeoGebra:
- Enter
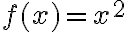 for the function.
 - Then enter
 to calculate the derivative of at
  .
.
What you will get:
GeoGebra will calculate and display the value of the derivative, which in this case is 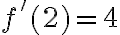 , indicating the slope of the tangent to the parabola at the point
 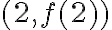 .
.
3. Displaying the Tangent Line to a Function at a Point
GeoGebra allows you to visualize the tangent line to a function at a specific point, which is useful for better understanding how the derivative represents the local slope.
Command in GeoGebra:
- Enter , to define the function.
- Then enter
![Tangent[1, f]](https://pok.kdevs.it/filter/tex/pix.php/2229a88f6249009dba4b12f3cf7d2091.gif "Tangent[1, f]") to display the tangent line to the parabola at
to display the tangent line to the parabola at  .
.
What you will get:
GeoGebra will draw the parabola and the tangent line at , allowing you to observe the slope of the curve at that point.
You can also display the tangent at a variable point.
Command in GeoGebra:
- Enter , to define the function.
- Enter
 , to create a slider.
 - Then enter
![Tangent[c, f]](https://pok.kdevs.it/filter/tex/pix.php/10af28e74e6894981844cddd8bc174b4.gif "Tangent[c, f]") to display the tangent line to the parabola at
to display the tangent line to the parabola at  .
.
By adjusting the slider, you can dynamically change the point of tangency.

4. Calculating Critical Points (Maxima, Minima, and Inflection Points)
GeoGebra can be used to find and visualize critical points, where the first derivative equals zero, and determine whether they are maxima, minima, or inflection points.
Command in GeoGebra:
- Enter to define the function.
- Enter
![Derivative[f]](https://pok.kdevs.it/filter/tex/pix.php/1de7cd77c848551d07a67686654656d8.gif "Derivative[f]") to compute the first derivative.
to compute the first derivative. - Then, use the command
![Solve[f'(x) = 0]](https://pok.kdevs.it/filter/tex/pix.php/5f59aed4f0aaac4f89f2e61e8f8b41d1.gif "Solve[f'(x) = 0]") to find the points where the derivative is zero.
to find the points where the derivative is zero.
What you will get:
GeoGebra will calculate and display the critical points, allowing you to analyze whether they are maxima, minima, or inflection points based on the sign of the second derivative or the behavior of the graph.
These examples illustrate just a few ways GeoGebra can be used to explore derivatives in different contexts: from calculating and visualizing derivatives to understanding the geometry of tangents, critical points, and local slopes.
In fact, GeoGebra has a large support community that openly shares many applets that can be freely used.
From the homepage, you can search for a resource by typing the word "derivative" to find many useful tools for:
Visualizing the Construction of the Derivative
Assessing your study
Dig deeper